Exploring Tweegeemee Data
Over the past few weeks, I’ve been having fun exploring some interesting questions about my twitter bot @tweegeemee. It started with this question from Kyle Oba @mudphone who asked: “if favs are normalized by time of day, and if different time zones have different style preferences.”
I had been meaning to look into what makes a popular image and if there are any correlations with time. This finally pushed me to do it.
I knew I needed to first organize the data in a database–I had not centrally organized it before. The data describing each image is posted in a gist file that contains all of the image description for a “generation” of images, one gist per generation. The popularity of each tweet is stored on twitter, accessible via Twitter API calls. So, I hacked together some Python code to grab image’s data from http://gist.github.com and from http://www.twitter.com/tweegeemee and merge the info together.
After a couple iterations, I came up with this schema which may or may not be very good since I’m no DBA.
key text PRIMARY KEY,   # "200723_013109_C"
# starting here is data from the gist file
name text NOT NULL,     # "200723_013109_C.clj"
# a gist URL is of the form https://gist.github.com/rogerallen/e4480c0d53063c1c06e1f0da3d1e6db8
gist_id text,           # "e4480c0d53063c1c06e1f0da3d1e6db8"
datetime text,          # 2020-07-23 01:31:09 (GMT)
julian_datetime real,   # the julian() function applied to datetime
kind text,              # "random", "mutant", "child"
parent0 text,           # key of parent 0 (or "")
parent1 text,           # key of parent 1 (or "")
hash integer,           # (hash of clojure code)
image_hash integer,     # (has of image data)
# every tweet has a URL like https://twitter.com/tweegeemee/status/1286111602169847808
twitter_id integer,     # 1286111602169847808 (ties the gist data to twitter)
code text NOT NULL      # the clojure code for the tweet
# the fields below come from the tweet's Twitter data
favorite_count integer, # twitter favorites
retweet_count integer,  # twitter retweets
image_url text,         # URL for the full image
gist_item_url text,     # URL for the lines in the gist for this tweet
and with my Python hackery, I gathered together about 6,000 tweets into the DB. While @tweegeemee has posted about 79,000 tweets since June, 2015, I only tied together the tweet ID to the gist data starting in March, 2020. I do have some ideas about getting older data, but the twitter API calls do not make it easy without a tweet ID, so for the moment we’ll need to be satisfied with 6,000.
With the data, I could query the information to find out the score for each tweet with this mixture of SQL & Pandas:
sql = """SELECT AVG(favorite_count) as avg_favorite,
                AVG(retweet_count) as avg_retweet,
                AVG(favorite_count + retweet_count) as avg_interact,
                AVG(favorite_count + 3*retweet_count) as avg_score,
                (cast(24*(julian_datetime - cast(julian_datetime as int)) as int) + 12) % 24 as hour FROM items
           WHERE favorite_count > 0 OR retweet_count > 0
           GROUP BY hour
           ORDER BY hour
           ;"""
df = pd.read_sql_query(sql, con)
df["pdt"] = (df["hour"]+7)%24
and this code visualized the hourly patterns (in Pacific Daylight Savings Time)
plt.style.use('fivethirtyeight')

df1 = df[["pdt","avg_score","avg_favorite","avg_retweet"]].copy()
df1.sort_values("pdt",inplace=True)
ax = df1.plot(x="pdt",kind="bar",figsize=(16,6),title="@tweegeeemee by hour")
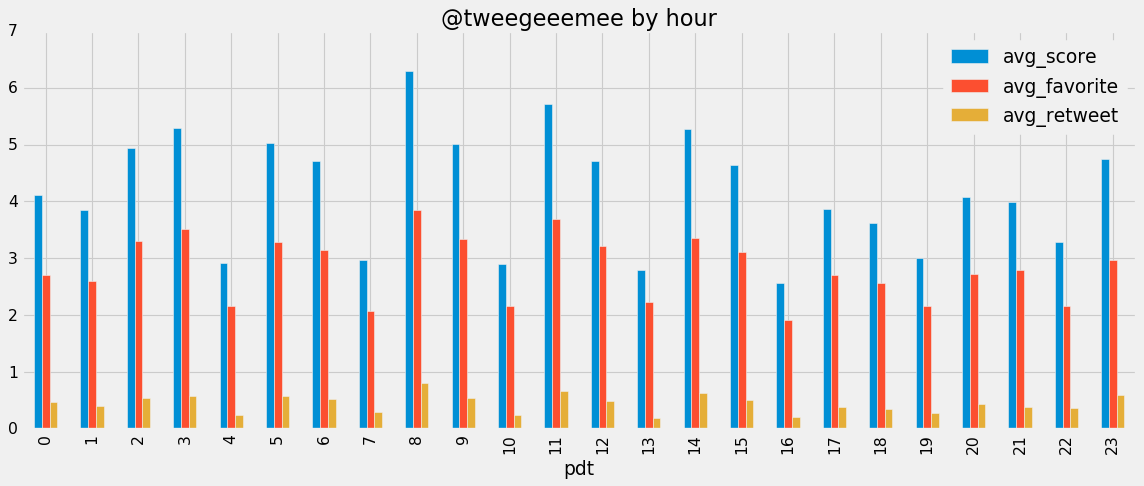
Now this was showing a clear pattern where every 3 hours images would not perform so well. After another conversation on twitter, one idea seemed likely–random image generation would likely have lower scores than evolved images with one or two parents.
sql = """SELECT AVG(favorite_count) as avg_favorite,
AVG(retweet_count) as avg_retweet,
AVG(favorite_count + retweet_count) as avg_interact,
AVG(favorite_count + 3*retweet_count) as avg_score,
(cast(24*(julian_datetime - cast(julian_datetime as int)) as int) + 12) % 24 as hour,
kind
FROM items
WHERE favorite_count > 0 OR retweet_count > 0
GROUP BY hour,kind
ORDER BY hour
;"""
df = pd.read_sql_query(sql, con)
df["pdt"] = ((df["hour"]+7)%24).astype(str).str.zfill(2)
df["pdt/kind"] = df["pdt"].astype(str)+"/"+df["kind"]
df1 = df[["pdt/kind","avg_score","avg_favorite","avg_retweet"]].copy()
df1.sort_values("pdt/kind",inplace=True)
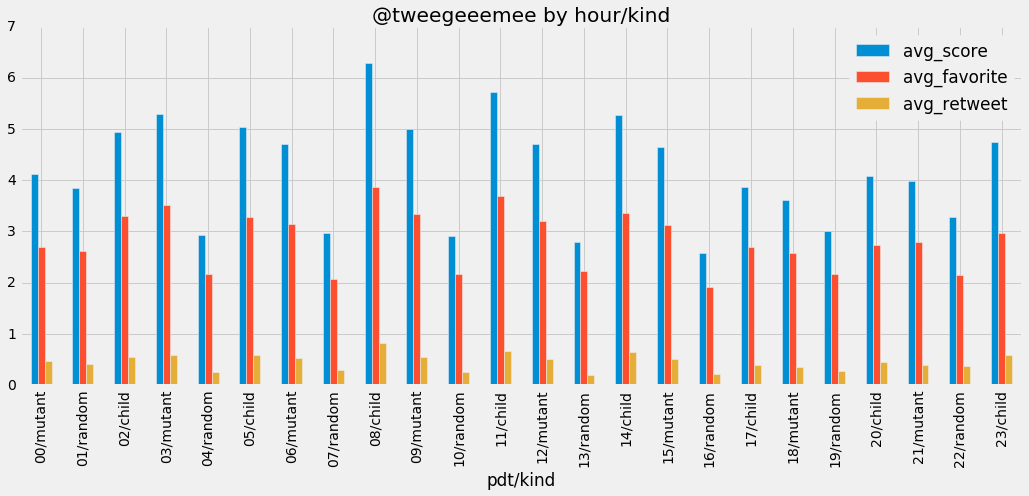
ax = df1.plot(x="pdt/kind",kind="bar",figsize=(16,6),title="@tweegeeemee by hour/kind")
Shows this is clearly the case:
Google Colab Notebook
If you find this interesting and would like to do some exploring yourself, I’ve made a smaller, 2,000-tweet database and a companion Google Colab Python Notebook that allows anyone to interact with data. This example also shows you how to display the images, too.
You will need to make a copy of the notebook and save it in your own Google Drive. The link for it is here. Note that if you have never saved a notebook to your own Google Drive via Google Colab before, you should try a tutorial and save that notebook to your Google Drive, first.
The database of 2,000 tweets is here. You need to download & save this file to your own Google Drive so the notebook can access it.
This notebook assumes you are familiar with Google Colab, SQL and the other imported libraries. As always, Stack Overflow is going to be your friend.
I hope you enjoy exploring @tweegeemee data. If you find any interesting results, please share them with @tweegeemee and @RogerAllen.
Thanks to Kyle Oba @mudphone for his help test-driving the Google Colab flow.